Leveraging the data in storm force winds…
17th March 2026
The Northern Cairngorms have been consistently battered by storm force winds today with frequent gusts recorded at 83 knots (95.5 mph), and a maximum of 102 mph on the summit of Cairn Gorm. These Southerly winds have accelerated over the plateau creating brutal conditions on the northern side of the massif.
These storm force winds curtailed observations at higher altitudes, with snow around Ciste Gully being stable spring snow in the mild temperatures. But with the greatest hazard forecast yesterday residing above 950 metres, this was a good opportunity to leverage the data provided by the SIMBA – Snow Ice Mass Balance Apparatus in Coire Cas. This remote monitoring station is a fraction under 1000 metres.
We are grateful for the assistance of SAMS Enterprise who provide this data for our exclusive use.
In terms of first graph (Figure 1), you can see the temperature trend at the site in Coire Cas. From 1800 15th March to 0600 on the 16th March there were cold overnight temperatures of -3 to -4. Following this the temperature reached positive figures. However, snow acts as an insulator and therefore snow temperatures often lag behind the changes in air temperature. This can be seen in Figure 2. At around 1120 the subsurface snow temperatures were close to -3 between 10 and 20cm depth. This can be seen in the screenshot of yesterday’s snow profile and the SIMBA profile from 1117. This is indicative of freshly accumulated windslab.
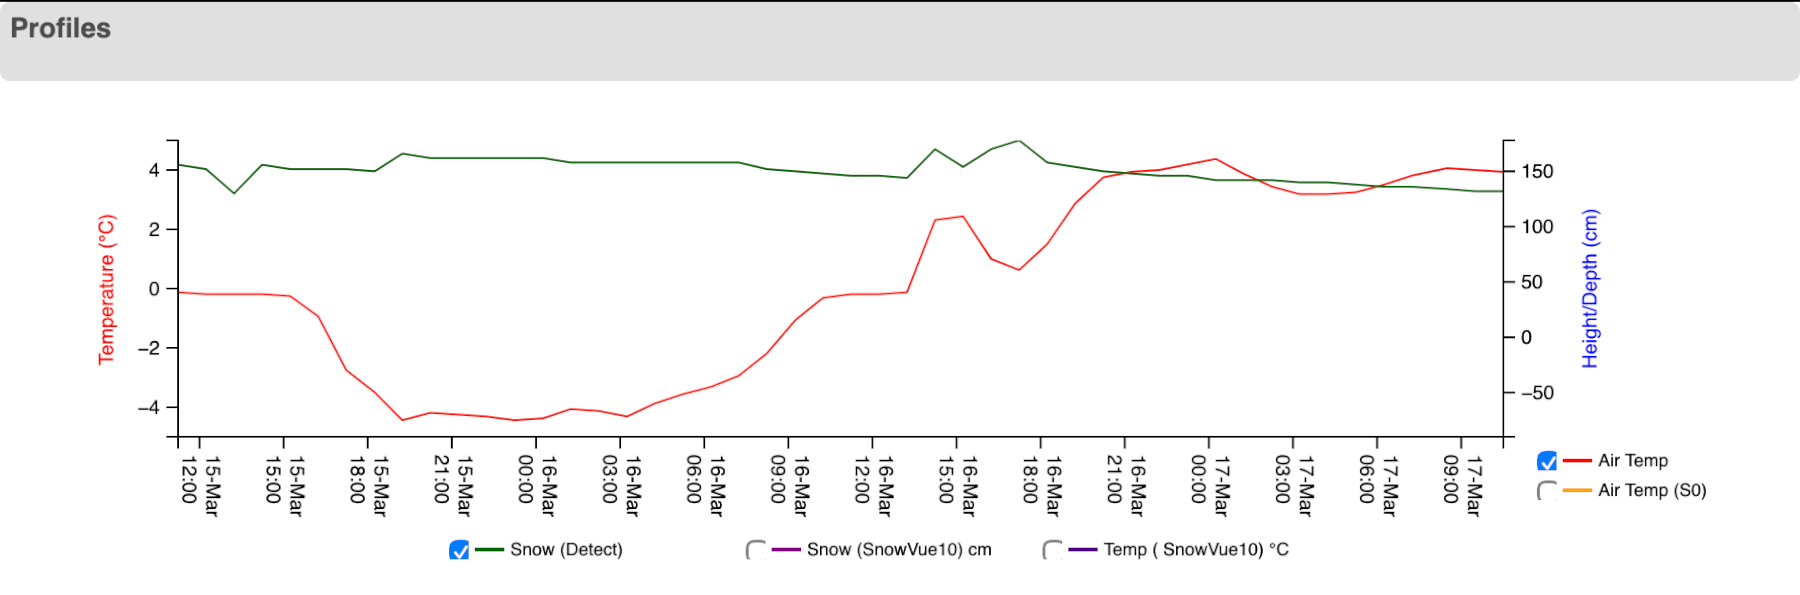
Figure 1: Air temperature trend at the SIMBA site in Coire Cas. Approximate snow depth in green. (c) SAMS Enterprise.
The SIMBA profile today at 1032 indicates a snowpack that is isothermal (close to 0 degrees). This is an indication that the snowpack has become more granular due to water and snow melt i.e. a spring snowpack. This is supported by the ‘snow level’ indicator which suggests the overall depth has reduced and consolidated. In yesterday’s profile there was a low density layer beneath the new windslab that was worthy of scrutiny today. Although we haven’t been able to examine that physically, the data suggests that the thaw has penetrated down to this level, and this layer is likely to have dissipated. But, we cannot tell that from these profiles alone.
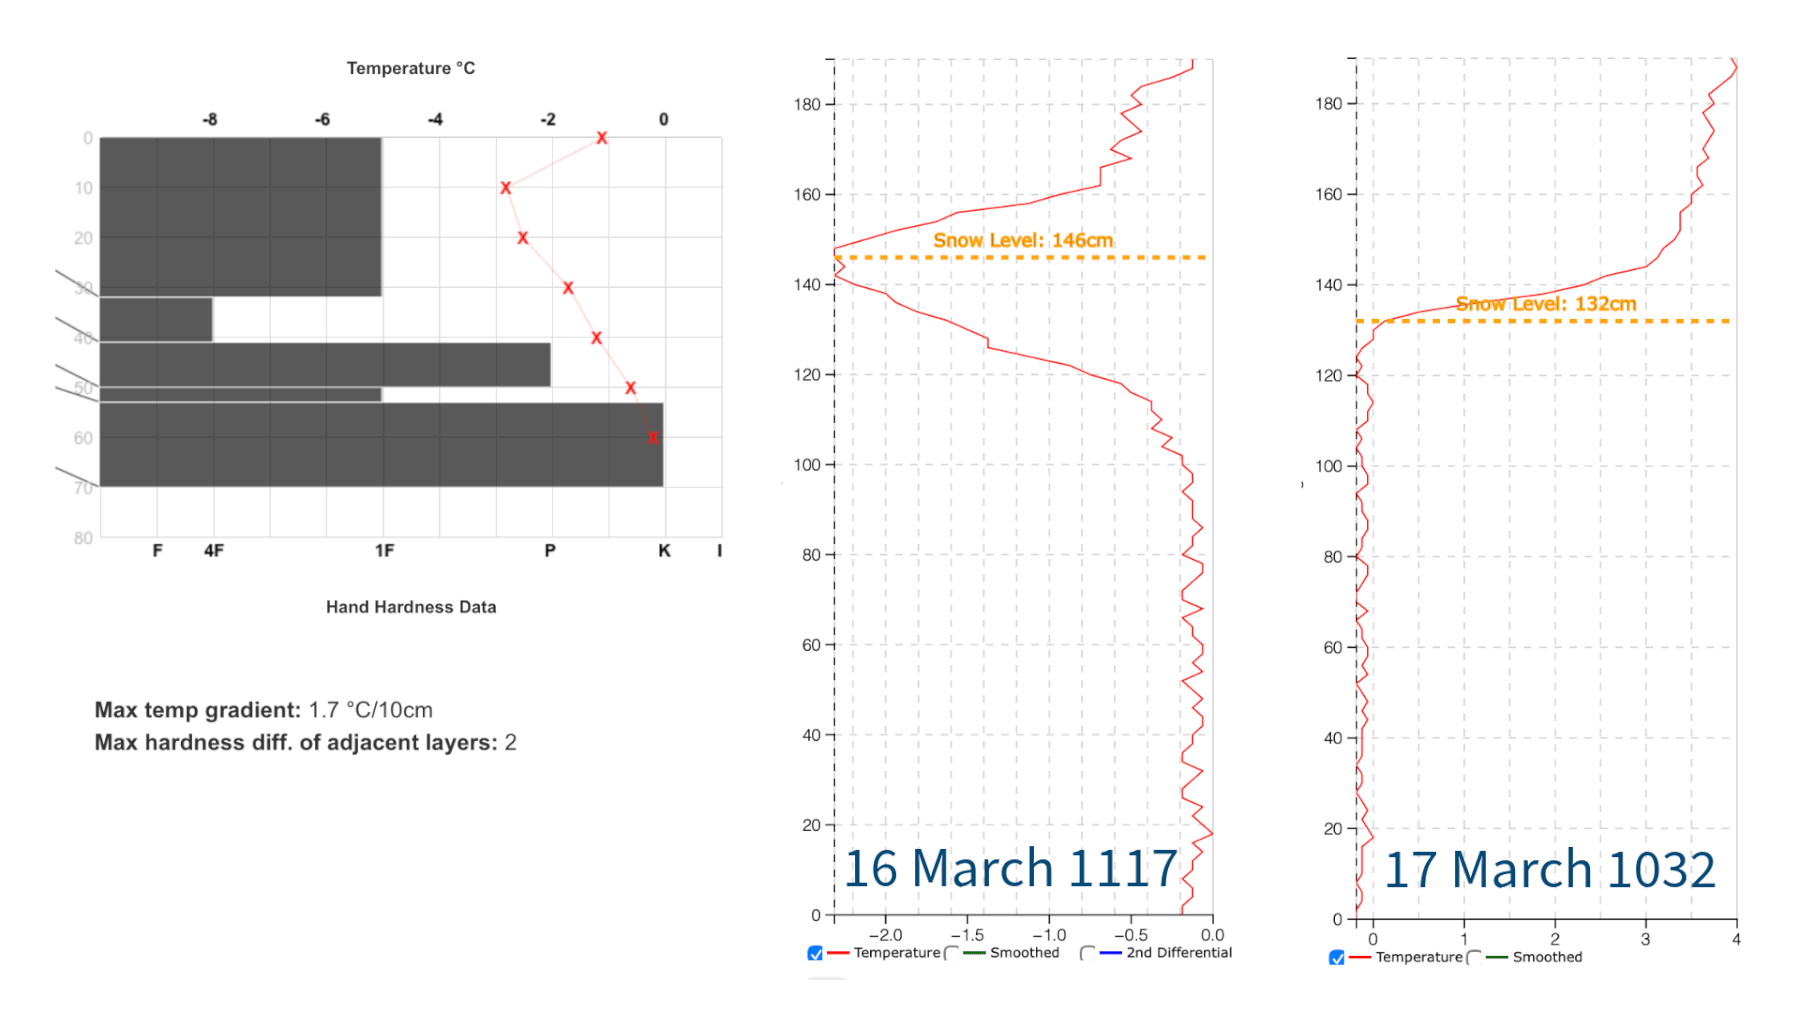
Figure 2: Left – yesterdays snow profile (16 March 1125). https://www.sais.gov.uk/snow_profile/20998/ Centre – the SIMBA profile from the 16 March (1117). Right – the SIMBA profile from the 17 March (1032). Note the presence of a temperature gradient of ~1.7 degrees / 10cm on the 16th March, which is absent on the 17 March, the result of rising temperatures and rainfall. However a careful look at the trend in figure 1 and the 1117 data will indicate that the snow temperatures have lagged behind the increasing air temperatures. It takes time for the thaw to penetrate the snowpack. (c) SAMS Enterprise.
For a deeper dive we can also switch to the heat mapping, seen here in Figures 3 and 4. Figure 3 again shows the trend over a similar period, specifically looking at 1800 15th March to 0600 on the 16th March the cold air temperatures can be seen in the blues and greens (legend on the right). By 1500 on the 16th March the yellows and reds are already indicating thaw conditions at the site, with positive temperatures at ~1000 metres. Also of interest is the black line which is an automated machine learning attempt at indicating the snow surface. Although there are some anomalies, this appears accurate, reducing in height as the snowpack consolidates. Figure 4 has plots temperature gradient, of particular interest here is the presence of a positive gradient of greater than 1 degree change per 10cm which can be indicative of vapour transport and potential facet growth. The presence of a gradient can be seen at around 38cm depth from the 15th to 16th of March after which this dissipates as the snowpack becomes isothermal.
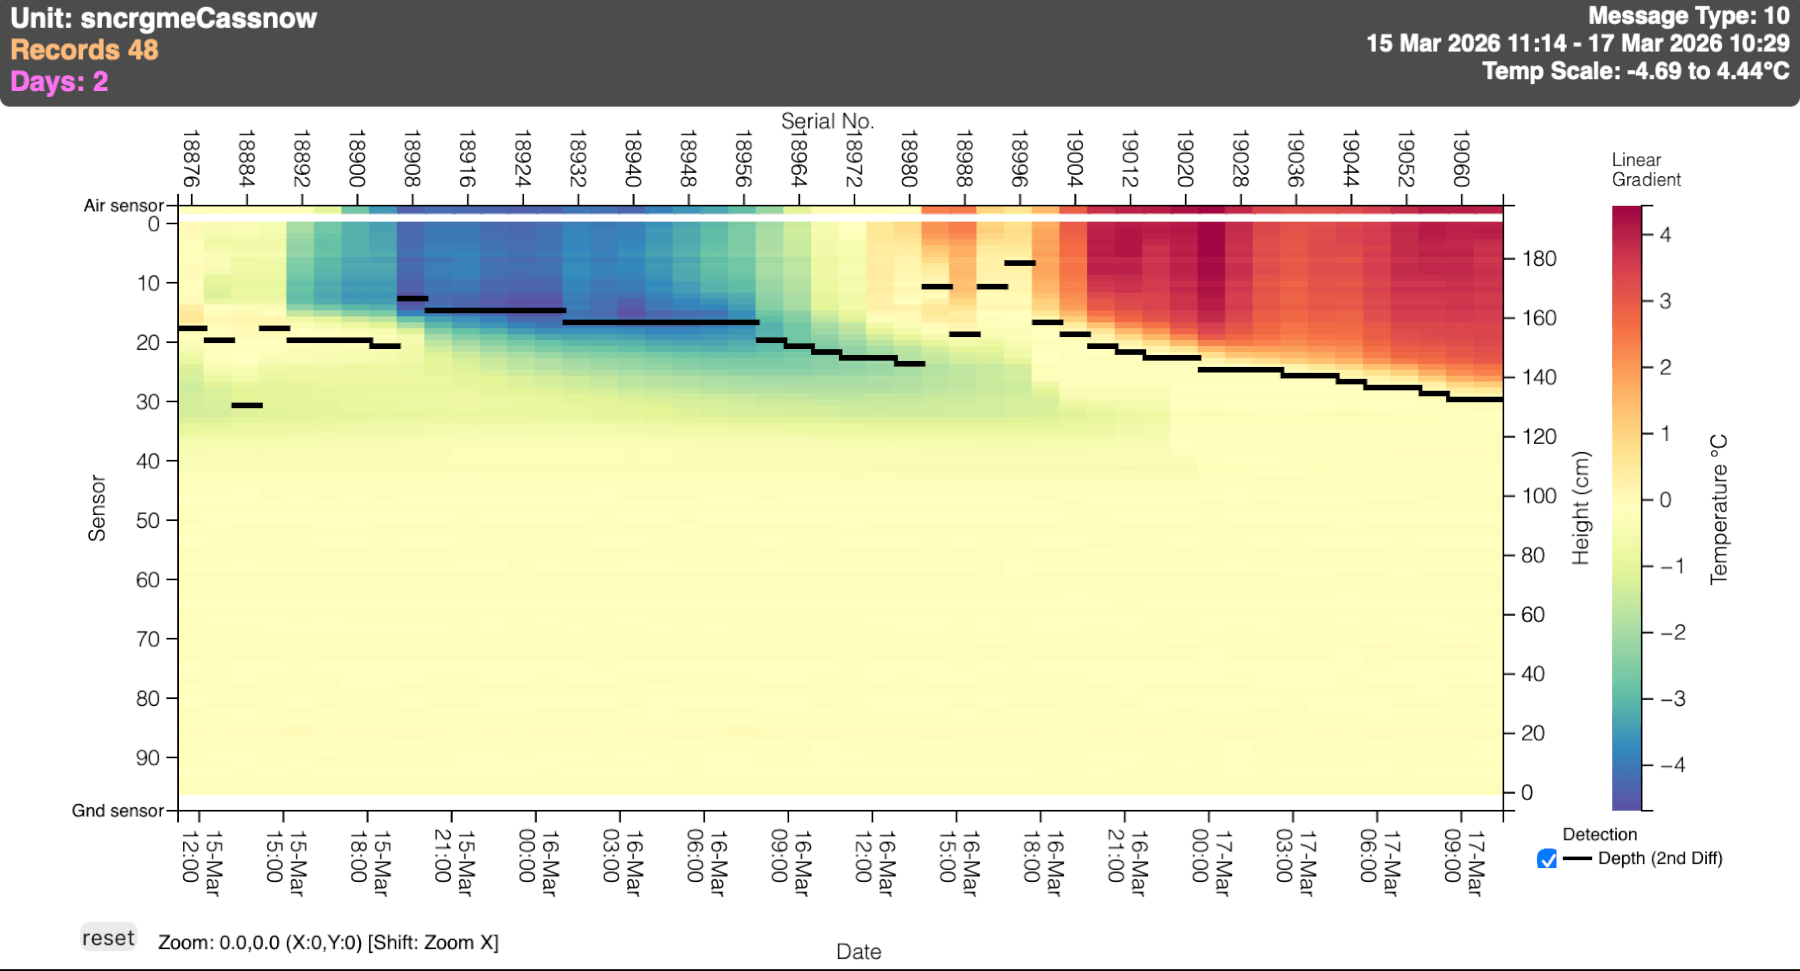
Figure 3: Heat mapping over a similar period. This plots temperature. Note the change from colder air temperatures to positive temperatures and the associated reducing snow depth. Also of interest is the presence of colder temperatures of fresh windslab which is visible at the ~30cm depth mark. (c) SAMS Enterprise.
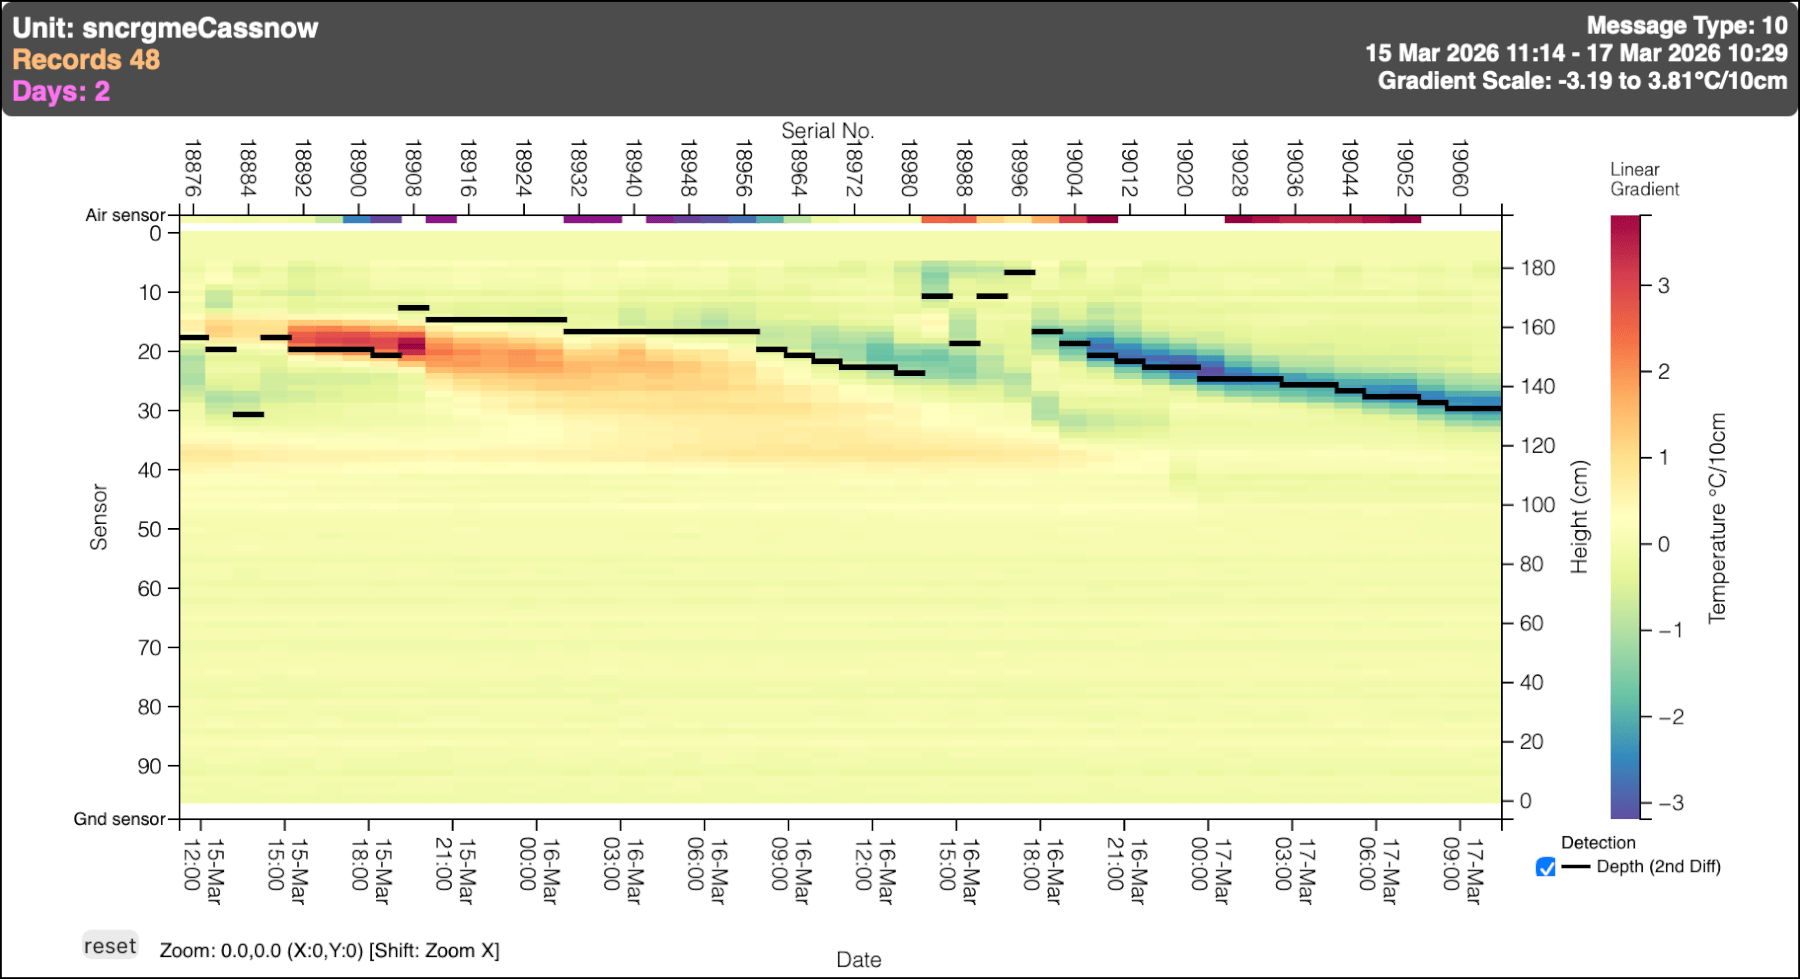
Figure 4: Heat map of temperature gradient i.e. greater than 1 degree change per 10cm. The orange and reds indicating a positive change is of particular relevance. (c) SAMS Enterprise.
Finally leveraging the data is one thing but it is important that we confirm our assumptions, however well they are supported by the information at our disposal. The “ground truth” is essential to confirm or challenge the mental model of the forecast conditions. Tomorrow’s observations will hold much value as will any reports of avalanche activity over the last 24 hour period. Please do submit anything you see here at: https://www.sais.gov.uk/report_avalanche/
At first glance there are quite a few fields, but any information is better than none, just fill in what you can. Thanks.
Comments on this post
Got something to say? Leave a comment